
Page 4 - CUA 2020_Functional Urology
P. 4
2020 CUA Abstracts
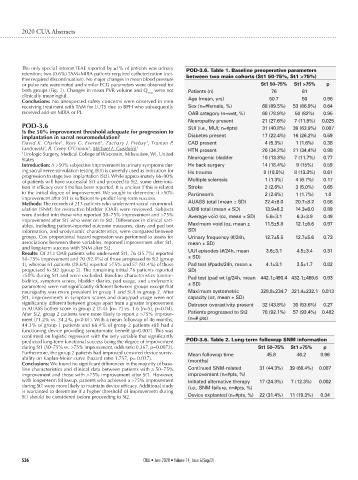
The only special interest TEAE reported by ≥1% of patients was urinary POD-3.6. Table 1. Baseline preoperative parameters
retention; two (0.6%) TAM+MIRA patients required catheterization (nei-
ther required discontinuation). No major changes in mean blood pressure between two main cohorts (St1 50-75%, St1 >75%)
or pulse rate were noted and similar ECG parameters were observed for St1 50–75% St1 >75% p
both groups (Fig. 1). Changes in mean PVR volume and Q max were not Patients (n) 76 61
clinically meaningful.
Conclusions: No unexpected safety concerns were observed in men Age (mean, yrs) 50.7 50 0.96
receiving treatment with TAM for LUTS due to BPH who subsequently Sex (n=#female, %) 68 (89.5%) 53 (86.9%) 0.64
received add-on MIRA or PL. OAB category (n=wet, %) 60 (78.9%) 50 (82%) 0.95
Neuropathy present 21 (27.6%) 7 (11.9%) 0.025
POD-3.6 SUI (i.e., MUI; n=#pts) 31 (40.8%) 39 (63.9%) 0.007
Is the 50% improvement threshold adequate for progression to
implantation in sacral neuromodulation? Diabetes present 17 (22.4%) 16 (26.2%) 0.59
David K. Charles , Ross G. Everett , Zachary J. Prebay , Truman P. CAD present 4 (5.3%) 1 (1.6%) 0.38
1
1
1
Landowski , R. Corey O’Connor , Michael L. Guralnick 1 HTN present 26 (34.2%) 21 (34.4%) 0.98
1
1
1 Urologic Surgery, Medical College of Wisconsin, Milwaukee, WI, United
States Neurogenic bladder 10 (13.3%) 7 (11.7%) 0.77
Introduction: A >50% subjective improvement in urinary symptoms dur- Hx back surgery 14 (18.4%) 9 (15%) 0.59
ing sacral nerve stimulation testing (St1) is currently used as indication for Hx trauma 8 (10.5%) 8 (13.3%) 0.61
progression to stage two implantation (St2). While approximately 66–90%
of patients will have successful St1 and proceed to St2, some deteriora- Multiple sclerosis 1 (1.3%) 4 (6.7%) 0.17
tion in efficacy over time has been reported. It is unclear if this is related Stroke 2 (2.6%) 3 (5.0%) 0.65
to the initial degree of improvement. We sought to determine if >50% Parkinson’s 2 (2.6%) 1 (1.7%) 1.0
improvement after St1 is sufficient to predict long-term success.
Methods: The records of 213 patients who underwent sacral neuromod- AUASS total (mean ± SD) 22.4±8.0 20.7±8.2 0.56
ulation (SNM) for overactive bladder (OAB) were reviewed. Subjects UDI6 total (mean ± SD) 13.9±6.2 14.3±6.0 0.89
were divided into those who reported 50–75% improvement and >75% Average void (oz, mean ± SD) 5.6±3.1 6.3±3.9 0.49
improvement after St1 who went on to St2. Differences in clinical vari-
ables, including patient-reported outcome measures, diary and pad test Maximum void (oz, mean ± 11.5±5.8 12.1±6.6 0.97
information, and urodynamic characteristics, were compared between SD)
groups. Cox proportional hazard regression was performed to assess for Urinary frequency (#/24h, 12.7±5.5 12.7±5.6 0.73
associations between these variables, reported improvement after St1, mean ± SD)
and long-term success with SNM after St2.
Results: Of 213 OAB patients who underwent St1, 76 (35.7%) reported UUI episodes (#/24h, mean 3.6±3.1 4.5±3.4 0.31
50–75% improvement and 70 (92.1%) of those progressed to St2 (group ± SD)
1), whereas 61 patients (28.6%) reported >75% and 57 (93.4%) of those Pad test (#pads/24h, mean ± 4.1±3.1 3.5±1.7 0.82
progressed to St2 (group 2). The remaining initial 76 patients reported SD)
<50% during St1 and were excluded. Baseline characteristics (comor- Pad test (pad wt (g/24h, mean 442.1±490.4 432.1±469.6 0.93
bidities, symptom scores, bladder diaries, pad usage, and urodynamic
parameters) were not significantly different between groups except that ± SD)
neuropathy was more prevalent in group 1 and SUI in group 2. After Maximum systometric 328.8±234.7 321.4±232.1 0.813
St1, improvements in symptom scores and diary/pad usage were not capacity (oz, mean ± SD)
significantly different between groups apart from a greater improvement Detrusor overactivity present 32 (43.8%) 30 (53.6%) 0.27
in AUASS bother score in group 2 (3.43 [n= 7] vs. 1.6 [n=5], p=0.04).
After St2, group 2 patients were more likely to report a >75% improve- Patients progressed to St2 70 (92.1%) 57 (93.4%) 0.482
ment (71.2% vs. 34.2%, p<0.01). With a mean followup of 46 months, (n=# pts)
44.3% of group 1 patients and 68.4% of group 2 patients still had a
functioning device providing symptomatic benefit (p=0.007). This was
confirmed on logistic regression with the only variable that significantly
predicted long-term functional success being the degree of improvement POD-3.6. Table 2. Long-term followup SNM information
during St1 (50–75% vs. >75% improvement, odds ratio 0.367, p=0.0072). St1 50–75% St1 >75% p
Furthermore, the group 2 patients had improved censored device surviv- Mean followup time 45.8 46.2 0.96
ability on Kaplan-Meier curve (hazard ratio 1.757, p= 0.037).
Conclusions: We found no significant differences in the majority of base- (months)
line characteristics and clinical data between patients with a 50–75% Continued SNM-related 31 (44.3%) 39 (68.4%) 0.007
improvement and those with >75% improvement after St1. However, improvement (n=#pts, %)
with longer-term followup, patients who achieved a >75% improvement Initiated alternative therapy 17 (24.3%) 7 (12.3%) 0.002
during St1 were more likely to maintain device efficacy. Additional study (i.e., SNM failure, n=#pts, %)
is warranted to determine if a higher threshold of improvement during
St1 should be considered before proceeding to St2. Device explanted (n=#pts, %) 22 (31.4%) 11 (19.3%) 0.34
S36 CUAJ • June 2020 • Volume 14, Issue 6(Suppl2)