
Page 4 - CUA 2020_Sexual Dysfunction and Transplant
P. 4
2020 CUA Abstracts
UP-2.6. Table 3. Estimated mean difference and 95%
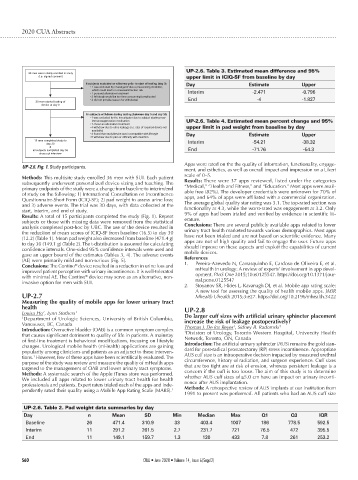
36 men were initially enrolled in study
(i.e. signed consent) upper limit in ICIQ-SF from baseline by day
6 subjects excluded or withdrew prior to start of testing (day 0) Day Estimate Upper
• 1 was excluded by investigator due a pre-existing condition,
which could lead to increased infection risk Interim -2.471 -0.796
• 1 pursued alternative treatment
• 2 felt study would be too time consuming/complicated
• 2 did not provide reason for withdrawal End -4 -1.827
30 men started testing of
device at day 0
15 subjects withdrew during testing (between day 0 and day 30)
• 1 was excluded by the investigator due to subject starting new
immunosuppressive medication UP-2.6. Table 4. Estimated mean percent change and 95%
• 1 chose an alternative treatment
• 4 withdrew due to urine leakage (i.e. size of required device not upper limit in pad weight from baseline by day
available)
• 4 found that study/device was incompatible with lifestyle Day Estimate Upper
• 5 withdrew due to pain or difficulty with insertion
15 men completed study to Interim -54.21 -38.32
day 30
&
all subjects completed day 56 End -71.76 -54.3
close out interview
Apps were rated on the the quality of information, functionality, engage-
UP-2.6. Fig. 1. Study participants.
ment, and esthetics, as well as overall impact and impression on a Likert
scale of 0–5.
Methods: This multisite study enrolled 36 men with SUI. Each patient
subsequently underwent personalized device sizing and teaching. The Results: There were 37 apps reviewed, listed under the categories
primary endpoints of the study were a change from baseline to interim/end “Medical,” “Health and Fitness,” and “Education.” Most apps were avail-
of study on the following: 1) International Consultation on Incontinence able free (82%). The developer credentials were unknown for 70% of
Questionnaire-Short Form (ICIQ-SF); 2) pad weight to assess urine loss; apps, and 64% of apps were affiliated with a commercial organization.
and 3) adverse events. The trial was 30 days, with data collected at the The average global quality star rating was 3.1. The top-rated section was
start, interim, and end of study. functionality at 4.3, while the worst-rated was engagement at 3.2. Only
Results: A total of 15 participants completed the study (Fig. 1). Repeat 9% of apps had been trialed and verified by evidence in scientific lit-
subjects or those with missing data were removed from the statistical erature.
analysis completed post-hoc by UBC. The use of the device resulted in Conclusions: There are several publicly available apps related to lower
the reduction of mean scores of ICIQ-SF from baseline (16.5) to day 30 urinary tract health marketed towards various demographics. Most apps
(12.2) (Table 1). Mean pad weight also decreased from baseline (471.4 g) have not been trialed and are not based on scientific evidence. Many
to day 30 (149.1 g) (Table 2). The t-distribution is assumed for calculating apps are not of high quality and fail to engage the user. Future apps
confidence intervals. One-sided 95% confidence intervals were used and should improve on these aspects and exploit the capabilities of current
gave an upper bound of the estimates (Tables 3, 4). The adverse events mobile devices.
(AE) were primarily mild and non-serious (Fig. 5). References
®
Conclusions: The Contino device resulted in a reduction in urine loss and 1. Pereira-Azevedo N, Carrasquinho E, Cardoso de Oliveira E, et al.
improved patient perception with urinary incontinence. It is well-tolerated mHealth in urology: A review of experts’ involvement in app devel-
with minimal AE. The Contino device may serve as an alternative, non- opment. PLoS One 2015;10:e0125547. https://doi.org/10.1371/jour-
®
invasive option for men with SUI. nal.pone.0125547
2. Stoyanov SR, Hides L, Kavanagh DJ, et al. Mobile app rating scale:
A new tool for assessing the quality of health mobile apps. JMIR
UP-2.7 Mhealth Uhealth 2015;3:e27. https://doi.org/10.2196/mhealth.3422
Measuring the quality of mobile apps for lower urinary tract
health UP-2.8
Louisa Ho , Lynn Stothers 1
1
1 Department of Urologic Sciences, University of British Columbia, Do larger cuff sizes with artificial urinary sphincter placement
Vancouver, BC, Canada increase the risk of leakage postoperatively?
1
1
Introduction: Overactive bladder (OAB) is a common symptom complex Thomas J. De los Reyes , Sidney B. Radomski
1
that causes significant detriment to quality of life in patients. A mainstay Division of Urology, Toronto Western Hospital, University Health
of first-line treatment is behavioral modifications, focusing on lifestyle Network, Toronto, ON, Canada
changes. Urological mobile health (mHealth) applications are gaining Introduction: The artificial urinary sphincter (AUS) remains the gold stan-
popularity among clinicians and patients as an adjunct to these interven- dard for post-radical prostatectomy (RP) stress incontinence. Appropriate
1
tions. However, few of these apps have been scientifically evaluated. The AUS cuff size is an intraoperative decision impacted by measured urethral
purpose of the study was review and measure the quality of mHealth apps circumference, history of radiation, and surgeon experience. Cuff sizes
targeted to the management of OAB and lower urinary tract symptoms. that are too tight are at risk of erosion, whereas persistent leakage is a
Methods: A systematic search of the Apple iTunes store was performed. concern if the cuff is too loose. The aim of this study is to determine
We included all apps related to lower urinary tract health for health whether AUS cuff sizes of ≥5.0 cm have an impact on urinary inconti-
professionals and patients. Expert raters trialed each of the apps and inde- nence after AUS implantation.
pendently rated their quality using a Mobile App Rating Scale (MARS). 2 Methods: A retrospective review of AUS implants at our institution from
1991 to present was performed. All patients who had an AUS cuff size
UP-2.6. Table 2. Pad weight data summaries by day
Day n Mean SD Min Median Max Q1 Q3 IQR
Baseline 26 471.4 310.9 33 403.4 1007 186 778.5 592.5
Interim 11 291.2 261.5 2.7 231.7 721 76.5 472 395.5
End 11 149.1 159.7 1.3 120 433 7.8 261 253.2
S60 CUAJ • June 2020 • Volume 14, Issue 6(Suppl2)