
Page 14 - CUA 2020_Pediatric
P. 14
Moderated Posters 12: Pediatric Urology
MP-12.4. Table 1 Patients’ demographics and final
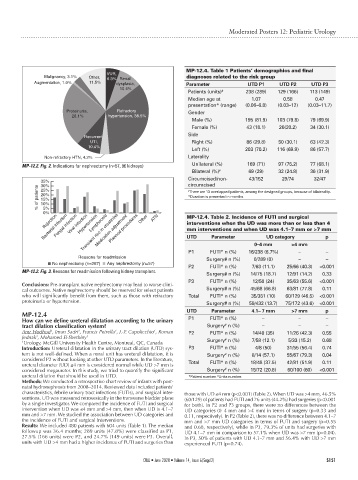
VUR,
Malignancy, 3.1% Other, diagnoses related to the risk group
6.3% Renal
Augmentation, 1.0% 11.5% dysplasia, Parameter UTD P1 UTD P2 UTD P3
10.4%
Patients (units) # 238 (289) 129 (166) 113 (149)
Median age at 1.07 0.58 0.47
presentation* (range) (0.06–6.8) (0.03–12) (0.03–11.7)
Proteinuria, Refractory Gender
28.1% hypertension, 38.5%
Male (%) 195 (81.9) 103 (79.8) 79 (69.9)
Female (%) 43 (18.1) 26(20.2) 34 (30.1)
Side
Recurrent
UTI, Right (%) 86 (29.8) 50 (30.1) 63 (42.3)
10.4%
Left (%) 203 (70.2) 116 (69.9) 86 (57.7)
Non-refractory HTN, 4.2% Laterality
MP-12.2. Fig. 2. Indications for nephrectomy (n=57, 96 kidneys) Unilateral (%) 169 (71) 97 (75.2) 77 (68.1)
Bilateral (%) # 69 (29) 32 (24.8) 36 (31.9)
Circumcised/non- 43/152 29/74 32/47
35% circumcised
30%
% of patients 25% # There are 13 overlapped patients, among the designed groups, because of bilaterality.
20%
*Duration is presented in months.
15%
10%
5%
0% Other ATN MP-12.4. Table 2. Incidence of FUTI and surgical
Transient rise in creatinine
Fungal infection
Bacterial infection Viral infection Lymphocele Planned procedures interventions when the UD was more than or less than 4
Medication adjustment
Rejection
Hypertension
mm interventions and when UD was 4.1–7 mm or >7 mm
Parameter
p
UD category
UTD
0–4 mm
–
P1 FUTI* n (%) 16/238 (6.7%) >4 mm –
Reasons for readmission Surgery# n (%) 0/289 (0) – –
No nephrectomy (n=267) Any nephrectomy (n=57)
P2 FUTI* n (%) 7/63 (11.1) 25/66 (40.3) <0.001
MP-12.2. Fig. 3. Reasons for readmission following kidney transplant.
Surgery# n (%) 14/75 (18.7) 12/91 (14.2) 0.33
P3 FUTI* n (%) 12/50 (24) 35/63 (55.6) <0.001
Conclusions: Pre-transplant native nephrectomy may lead to worse clini-
cal outcomes. Native nephrectomy should be reserved for select patients Surgery# n (%) 45/68 (66.8) 63/81 (77.8) 0.11
who will significantly benefit from them, such as those with refractory Total FUTI* n (%) 35/351 (10) 60/129 (46.5) <0.001
proteinuria or hypertension. Surgery# n (%) 59/432 (13.7) 75/172 (43.6) <0.001
UTD Parameter 4.1– 7 mm >7 mm p
MP-12.4
How can we define ureteral dilatation according to the urinary P1 FUTI* n (%) – – –
tract dilation classification system? Surgery n (%) – – –
#
Amr Hodhod , Iman Sadri , Francis Petrella , J.-P. Capolicchio , Roman P2 FUTI* n (%) 14/40 (35) 11/26 (42.3) 0.55
1
1
1
1
Jednak , Mohamed El-Sherbiny 1 #
1
1 Urology, McGill University Health Centre, Montreal, QC, Canada Surgery n (%) 7/58 (12.1) 5/33 (15.2) 0.68
Introduction: Ureteral dilatation in the urinary tract dilation (UTD) sys- P3 FUTI* n (%) 4/8 (50) 31/55 (56.4) 0.74
tem is not well-defined. When a renal unit has ureteral dilatation, it is Surgery n (%) 8/14 (57.1) 55/67 (79.3) 0.04
#
considered P2 without looking at other UTD parameters. In the literature,
ureteral diameter (UD) ≤4 mm is considered normal while UD >7 mm is Total FUTI* n (%) 18/48 (37.5) 42/81 (51.9) 0.11
considered megaureter. In this study, we tried to quantify the significant Surgery n (%) 15/72 (20.8) 60/100 (60) <0.001
#
ureteral dilation that should be used in UTD. *Patient number. # Units number.
Methods: We conducted a retrospective chart review of infants with post-
natal hydronephrosis from 2008–2014. Reviewed data included patients’
characteristics, febrile urinary tract infections (FUTIs), and surgical inter- those with UD ≤4 mm (p<0.001) (Table 2). When UD was >4 mm, 46.5%
ventions. UD was measured retrovesically in the transverse bladder plane (60/129) of patients had FUTI and 76 units (44.2%) had surgeries (p<0.001
by a single investigator. We compared the incidence of FUTI and surgical for both). In P2 and P3 groups, there were no differences between the
intervention when UD was ≤4 mm and >4 mm, then when UD is 4.1–7 UD categories (0–4 mm and >4 mm) in terms of surgery (p=0.33 and
mm and >7 mm. We studied the association between UD categories and 0.11, respectively). In P2 (Table 2), there was no difference between 4.1–7
the incidence of FUTI and surgical interventions. mm and >7 mm UD categories in terms of FUTI and surgery (p=0.55
Results: We included 480 patients with 604 units (Table 1). The median and 0.68, respectively), while in P3, 79.3% of units had surgeries with
followup was 36.4 months; 289 units (47.8%) were classified as P1, UD 4.1–7 mm in comparison to 57.1% when UD was >7 mm (p=0.04).
27.5% (166 units) were P2, and 24.7% (149 units) were P3. Overall, In P3, 50% of patients with UD 4.1–7 mm and 56.4% with UD >7 mm
units with UD >4 mm had a higher incidence of FUTI and surgeries than experienced FUTI (p=0.74).
CUAJ • June 2020 • Volume 14, Issue 6(Suppl2) S151