
Page 7 - CUA 2020_Trauma and Reconstruction
P. 7
Moderated Posters 2: Trauma, Reconstruction, Pelvic Pain
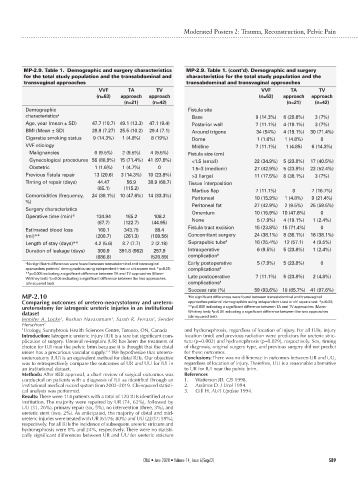
MP-2.9. Table 1. Demographic and surgery characteristics MP-2.9. Table 1. (cont’d). Demographic and surgery
for the total study population and the transabdominal and characteristics for the total study population and the
transvaginal approaches transabdominal and transvaginal approaches
VVF TA TV VVF TA TV
(n=63) approach approach (n=63) approach approach
(n=21) (n=42) (n=21) (n=42)
Demographic Fistula site
characteristics a Base 9 (14.3%) 6 (28.6%) 3 (7%)
Age, year (mean ± SD) 47.7 (10.7) 49.1 (13.3) 47.1 (9.4) Posterior wall 7 (11.1%) 4 (19.1%) 3 (7%)
BMI (Mean ± SD) 28.8 (7.27) 25.5 (10.2) 29.4 (7.1) Around trigone 34 (54%) 4 (19.1%) 30 (71.4%)
Cigarette smoking status 9 (14.3%) 1 (4.8%) 8 (19%) Dome 1 (1.6%) 1 (4.8%) 0
VVF etiology Midline 7 (11.1%) 1 (4.85) 6 (14.3%)
Malignancies 6 (9.5%) 2 (9.5%) 4 (9.5%) Fistula size (cm)
Gynecological procedures 56 (88.9%) 15 (71.4%) 41 (97.6%) <1.5 (small) 22 (34.9%) 5 (23.8%) 17 (40.5%)
Obstetric 1 (1.6%) 1 (4.7%) 0 1.5–3 (medium) 27 (42.9%) 5 (23.8%) 22 (52.4%)
Previous fistula repair 13 (20.6) 3 (14.3%) 10 (23.8%) >3 (large) 11 (17.5%) 8 (38.1%) 3 (7%)
Timing of repair (days) 44.47 56.9 38.9 (68.7) Tissue interposition
(85.1) (115.2) Martius flap 7 (11.1%) 0 7 (16.7%)
Comorbidities (frequency, 24 (38.1%) 10 (47.6%) 14 (33.3%) Peritoneal 10 (15.9%) 1 (4.8%) 9 (21.4%)
%) Peritoneal fat 27 (42.9%) 2 (9.5%) 25 (59.5%)
Surgery characteristics Omentum 10 (15.9%) 10 (47.6%) 0
Operative time (min)* 134.94 185.2 108.2
(87.7) (122.7) (44.95) None 5 (7.9%) 4 (19.1%) 1 (2.4%)
Estimated blood loss 160.1 343.75 88.4 Fistula tract excision 15 (23.8%) 15 (71.4%) 0
(ml)** (200.7) (261.3) (109.56) Concomitant surgery 24 (38.1%) 8 (38.1%) 16 (38.1%)
Length of stay (days)** 4.2 (5.6) 8.7 (7.7) 2 (2.18) Suprapubic tube # 16 (25.4%) 12 (57.1) 4 (9.5%)
Duration of leakage (days) 300.9 391.8 (962) 257.9 Intraoperative 6 (9.5%) 5 (23.8%) 1 (2.4%)
(686.8) (520.89) complication #
Early postoperative 5 (7.9%) 5 (23.8%) 0
a No significant differences were found between transabdominal and transvaginal
approaches patients’ demographics using independent t-test or chi square test. *p<0.05; complications #
**p<0.005 indicating a significant difference between TA and TV approaches (Mann-
Whitney test); # p<0.05 indicating a significant difference between the two approaches Late postoperative 7 (11.1%) 5 (23.8%) 2 (4.8%)
(chi-squared test). complications #
Success rate (%) 59 (93.6%) 18 (85.7%) 41 (97.6%)
MP-2.10 a No significant differences were found between transabdominal and transvaginal
Comparing outcomes of uretero-neocystotomy and uretero- approaches patients’ demographics using independent t-test or chi square test. *p<0.05;
ureterostomy for iatrogenic ureteric injuries in an institutional **p<0.005 indicating a significant difference between TA and TV approaches (Mann-
dataset Whitney test); # p<0.05 indicating a significant difference between the two approaches
(chi-squared test).
Jennifer A. Locke , Roshan Navaratnam , Sarah R. Ferrara , Sender
1
1
1
Herschorn 1
1 Urology, Sunnybrook Health Sciences Centre, Toronto, ON, Canada and hydronephrosis, regardless of location of injury. For all IUIs, injury
Introduction: Iatrogenic ureteric injury (IUI) is a rare but significant com- location (mid) and previous radiation were predictors for ureteric stric-
plication of surgery. Ureteral re-implant (UR) has been the treatment of ture (p=0.002) and hydronephrosis (p=0.029), respectively. Sex, timing
choice for IUI near the pelvic brim because it is thought that the distal of diagnosis, original surgery type, and previous surgery did not predict
ureter has a precarious vascular supply. We hypothesize that uretero- for these outcomes.
1-3
ureterostomy (UU) is an equivalent method for distal IUIs. Our objective Conclusions: There was no difference in outcomes between UR and UU,
was to retrospectively compare the outcomes of UR and UU for IUI in regardless of location of injury. Therefore, UU is a reasonable alternative
an institutional dataset. to UR for IUI near the pelvic brim.
Methods: After REB approval, a chart review of surgical outcomes was References
conducted on patients with a diagnosis of IUI as identified through an 1. Watterson JD. CJS 1998.
institutional medical record system from 2002–2019. Chi-squared statisti- 2. Assimos D. J Urol 1994.
cal analysis was performed. 3. Gill H. AUA Update 1994.
Results: There were 114 patients with a total of 120 IUIs identified at our
institution. The majority were repaired by UR (74, 62%), followed by
UU (31, 26%), primary repair (six, 5%), no intervention (three, 3%), and
ureteric stent (two, 2%). As anticipated, the majority of distal and mid-
ureteric injuries were treated with UR (61/76; 80%) and UU (22/37; 59%),
respectively. For all IUIs the incidence of subsequent ureteric stricture and
hydronephrosis were 8% and 24%, respectively. There were no statisti-
cally significant differences between UR and UU for ureteric stricture
CUAJ • June 2020 • Volume 14, Issue 6(Suppl2) S89