
Page 92 - CUA Absracts 2022_Fulldraft
P. 92
2022 CUA Abstracts
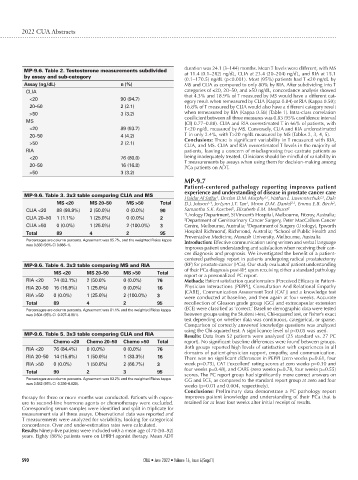
MP-9.6. Table 2. Testosterone measurements subdivided duration was 24.1 (3–144) months. Mean T levels were different, with MS
at 11.4 (0.1–282) ng/dL, CLIA at 23.4 (20–204) ng/dL, and RIA at 15.1
by assay and sub-category (0.1–170.5) ng/dL (p<0.001). Most (95%) patients had T ≤20 ng/dL by
Assay (ng/dL) n (%) MS and CLIA as compared to only 80% by RIA. After subdividing into T
CLIA categories of ≤20, 20–50, and ≥50 ng/dL, concordance analysis showed
that 4.3% and 18.9% of T measured by MS would have a different cat-
<20 90 (94.7) egory result when remeasured by CLIA (Kappa 0.84) or RIA (Kappa 0.50);
20–50 2 (2.1) 16.8% of T measured by CLIA would also have a different category result
>50 3 (3.2) when remeasured by RIA (Kappa 0.58) (Table 1). Intra-class correlation
MS coefficient between all three measures was 0.83 (95% confidence interval
[CI] 0.77–0.88). CLIA and RIA overestimated T in 66% of patients, with
<20 89 (93.7) T<20 ng/dL measured by MS. Conversely, CLIA and RIA underestimated
20–50 4 (4.2) T in only 2.4%, with T>20 ng/dL measured by MS (Tables 2, 3, 4, 5).
Conclusions: There is significant variability in T measured with RIA,
>50 2 (2.1) CLIA, and MS. CLIA and RIA overestimated T levels in the majority of
RIA patients, leaving a concern of misdiagnosing true castrate patients as
<20 76 (80.0) being inadequately treated. Clinicians should be mindful of variability in
T measurements by assays when using them for decision-making among
20–50 16 (16.8) PCa patients on ADT.
>50 3 (3.2)
MP-9.7
Patient-centered pathology reporting improves patient
experience and understanding of disease in prostate cancer care
MP-9.6. Table 3. 3x3 table comparing CLIA and MS Haidar Al Saffar , Declan D.M. Murphy , Nathan L. Lawrentschuk , Dale
1
2,3
2,3
MS <20 MS 20–50 MS >50 Total D.J. Jobson , Jo-Lynn J.T. Tan , Moon D.M. Daniel , Emma E.B. Birch ,
1
2
1,4
2,3
2
CLIA <20 88 (98.9%) 2 (50.0%) 0 (0.0%) 90 Samantha S.K. Koschel , Elizabeth E.M. Medhurst 2
1 Urology Department, St Vincent’s Hospital, Melbourne, Fitzroy, Australia;
CLIA 20–50 1 (1.1%) 1 (25.0%) 0 (0.0%) 2 2 Department of Genitourinary Cancer Surgery, Peter MacCallum Cancer
CLIA >50 0 (0.0%) 1 (25.0%) 2 (100.0%) 3 Centre, Melbourne, Australia; Department of Surgery (Urology), Epworth
3
4
Total 89 4 2 95 Hospital Richmond, Richmond, Australia; School of Public Health and
Preventative Medicine, Monash University, Melbourne, Australia
Percentages are column percents. Agreement was 95.7%, and the weighted Fleiss kappa Introduction: Effective communication using written and verbal language
was 0.838 (95% CI 0.656–1).
improves patient understanding and satisfaction when receiving their can-
cer diagnosis and prognosis. We investigated the benefit of a patient-
centered pathology report in patients undergoing radical prostatectomy
MP-9.6. Table 4. 3x3 table comparing MS and RIA (RP) for prostate cancer (PCa). Our study evaluated patient understanding
MS <20 MS 20–50 MS >50 Total of their PCa diagnosis post-RP, upon receiving either a standard pathology
report or a personalized PC report.
RIA <20 74 (83.1%) 2 (50.0% 0 (0.0%) 76 Methods: Patient satisfaction questionnaires (Perceived Efficacy in Patient-
RIA 20–50 15 (16.9%) 1 (25.0%) 0 (0.0%) 16 Physician Interactions [PEPPI], Consultation And Relational Empathy
[CARE], Communication Assessment Tool [CAT]) and a knowledge test
RIA >50 0 (0.0%) 1 (25.0%) 2 (100.0%) 3 were conducted at baseline, and then again at four weeks. Accurate
Total 89 4 2 95 recollection of Gleason grade group (GG) and extracapsular extension
Percentages are column percents. Agreement was 81.1% and the weighted Fleiss kappa (ECE) were classified as ‘correct.’ Baseline demographic data were tested
was 0.504 (95% CI 0.207–0.801). between groups using the Student t-test, Chi-squared test, or Fisher’s exact
test depending on whether data was continuous, categorical, or sparse.
Comparison of correctly answered knowledge questions was analyzed
using the Chi-squared test. A significance level of p<0.05 was used.
MP-9.6. Table 5. 3x3 table comparing CLIA and RIA Results: Data from 52 patients were analyzed (25 standard vs. 27 PC
Chemo <20 Chemo 20–50 Chemo >50 Total report). No significant baseline differences were found between groups.
RIA <20 76 (84.4%) 0 (0.0%) 0 (0.0%) 76 Both groups reported high levels of satisfaction with experiences in all
domains of patient-physician rapport, empathy, and communication.
RIA 20–50 14 (15.6%) 1 (50.0%) 1 (33.3%) 16 There was no significant differences in PEPPI (zero weeks p=0.61, four
RIA >50 0 (0.0%) 1 (50.0%) 2 (66.7%) 3 week p=0.75), CAT (‘excellent’ rating scores at zero weeks p=0.30 and
Total 90 2 3 95 four weeks p=0.48), and CARE (zero weeks p=0.78, four weeks p=0.55)
scores. The PC report group had significantly more correct answers on
Percentages are column percents. Agreement was 83.2% and the weighted Fleiss kappa GG and ECE, as compared to the standard report group at zero and four
was 0.582 (95% CI 0.336–0.828). weeks (p=0.01 and 0.004, respectively).
Conclusions: Preliminary data demonstrate a PC pathology report
therapy for three or more months was conducted. Patients with expos- improves patient knowledge and understanding of their PCa that is
ure to second-line hormone agents or chemotherapy were excluded. retained for at least four weeks after initial receipt of results.
Corresponding serum samples were identified and split in triplicate for
measurement via all three assays. Observational data was reported and
T measurements were analyzed for variability, looking for categorical
concordance. Over and under-estimation rates were calculated.
Results: Ninety-five patients were included with a mean age of 70 (50–92)
years. Eighty (88%) patients were on LHRH agonist therapy. Mean ADT
S90 CUAJ • June 2022 • Volume 16, Issue 6(Suppl1)