
Page 13 - Poster Sessions] CUA 2022 Annual Meeting Abstracts
P. 13
Poster 2: BPH
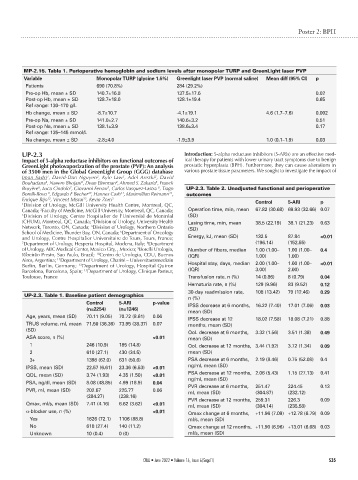
MP-2.15. Table 1. Perioperative hemoglobin and sodium levels after monopolar TURP and GreenLight laser PVP
Variable Monopolar TURP (glycine 1.5%) Greenlight laser PVP (normal saline) Mean diff (95% CI) p
Patients 690 (70.8%) 284 (29.2%)
Pre-op Hb, mean ± SD 140.7±16.8 137.5±17.6 0.02
Post-op Hb, mean ± SD 128.7±18.0 128.1±19.4 0.65
Ref range: 130–170 g/L
Hb change, mean ± SD -8.7±10.7 -4.1±19.1 4.6 (1.7–7.6) 0.002
Pre-op Na, mean ± SD 141.0±2.7 140.6±3.2 0.51
Post-op Na, mean ± SD 138.1±3.9 138.6±3.4 0.17
Ref range: 135–145 mmol/L
Na change, mean ± SD -2.8±4.0 -1.9±3.9 1.0 (0.1–1.9) 0.03
UP-2.3 Introduction: 5-alpha reductase inhibitors (5-ARIs) are an effective med-
Impact of 5-alpha reductase inhibitors on functional outcomes of ical therapy for patients with lower urinary tract symptoms due to benign
GreenLight photovaporization of the prostate (PVP): An analysis prostatic hyperplasia (BPH). Furthermore, they can cause alterations in
of 3500 men in the Global GreenLight Group (GGG) database various prostate tissue parameters. We sought to investigate the impact of
Iman Sadri , David-Dan Nguyen , Kyle Law , Adel Arezki , David
3
2
2
1
Bouhadana , Naeem Bhojani , Dean Elterman , Ahmed S. Zakaria , Franck
3
5
4
2
8
7
6
7
Bruyère , Luca Cindolo , Giovanni Ferrari , Carlos Vasquez-Lastra , Tiago UP-2.3. Table 2. Unadjusted functional and perioperative
11
9
11
Borelli-Bovo , Edgardo F Becher , Hannes Cash , Maximillian Reimann , outcomes
10
12
Enrique Rijo , Vincent Misrai , Kevin Zorn 3
13
1 Division of Urology, McGill University Health Centre, Montreal, QC, Control 5-ARI p
2
Canada; Faculty of Medicine, McGill University, Montreal, QC, Canada; Operation time, min, mean 67.82 (30.68) 69.93 (32.66) 0.07
3 Division of Urology, Centre Hospitalier de l’Université de Montréal (SD)
4
(CHUM), Montreal, QC, Canada; Division of Urology, University Health Lasing time, min, mean 38.5 (22.19) 38.1 (21.23) 0.63
5
Network, Toronto, ON, Canada; Division of Urology, Northern Ontario (SD)
6
School of Medicine, Thunder Bay, ON, Canada; Department of Oncology
and Urology, Centre Hospitalier Universitaire de Tours, Tours, France; Energy, kJ, mean (SD) 132.5 87.84 <0.01
7 Department of Urology, Hesperia Hospital, Modena, Italy; Department (196.14) (152.55)
8
of Urology, ABC Medical Center, Mexico City, , Mexico; Borelli Urologia, Number of fibers, median 1.00 (1.00– 1.00 (1.00– 0.4
9
Ribeirão Presto, Sao Paulo, Brazil; Centro de Urologia, CDU, Buenos (IQR) 1.00) 1.00)
10
11
Aires, Argentina; Department of Urology, Charité – Universitaetsmedizin
12
Berlin, Berlin, Germany; Department of Urology, Hospital Quiron Hospital stay, days, median 2.00 (1.00– 1.00 (1.00– <0.01
13
Barcelona, Barcelona, Spain; Department of Urology, Clinique Pasteur, (IQR) 3.00) 2.00)
Toulouse, France Transfusion rate, n (%) 14 (0.86) 8 (0.79) 0.04
Hematuria rate, n (%) 129 (9.96) 83 (9.52) 0.12
30-day readmission rate, 108 (13.42) 79 (12.46) 0.29
UP-2.3. Table 1. Baseline patient demographics n (%)
Control 5-ARI p-value IPSS decrease at 6 months, 16.22 (7.40) 17.01 (7.06) 0.03
(n=2254) (n=1246) mean (SD)
Age, years, mean (SD) 70.11 (9.05) 70.72 (8.61) 0.06 IPSS decrease at 12 18.02 (7.58) 18.08 (7.21) 0.88
TRUS volume, ml, mean 71.50 (36.36) 73.95 (38.37) 0.07 months, mean (SD)
(SD) QoL decrease at 6 months, 3.32 (1.56) 3.51 (1.38) 0.49
ASA score, n (%) <0.01 mean (SD)
1 246 (10.9) 185 (14.8) QoL decrease at 12 months, 3.44 (1.92) 3.72 (1.34) 0.09
2 610 (27.1) 430 (34.5) mean (SD)
3+ 1398 (62.0) 631 (50.6) PSA decrease at 6 months, 2.19 (8.46) 0.75 (52.08) 0.4
IPSS, mean (SD) 22.57 (6.61) 23.36 (6.53) <0.01 ng/ml, mean (SD)
QOL, mean (SD) 3.74 (1.93) 4.35 (1.50) <0.01 PSA decrease at 12 months, 2.06 (5.43) 1.15 (27.13) 0.41
ng/ml, mean (SD)
PSA, ng/dl, mean (SD) 8.08 (48.85) 4.99 (18.9) 0.04 PVR decrease at 6 months, 251.47 224.45 0.13
PVR, ml, mean (SD) 202.67 225.77 0.06 ml, mean (SD) (304.87) (232.12)
(284.27) (238.16) PVR decrease at 12 months, 259.31 226.3 0.09
Qmax, ml/s, mean (SD) 7.41 (4.16) 6.62 (3.62) <0.01 ml, mean (SD) (304.14) (235.58)
α-blocker use, n (%) <0.01 Qmax change at 6 months, +11.96 (7.09) +12.78 (6.79) 0.09
Yes 1626 (72.1) 1106 (88.8) ml/s, mean (SD)
No 618 (27.4) 140 (11.2) Qmax change at 12 months, +11.90 (6.96) +13.01 (6.68) 0.03
Unknown 10 (0.4) 0 (0) ml/s, mean (SD)
CUAJ • June 2022 • Volume 16, Issue 6(Suppl1) S35