
Page 48 - Demo
P. 48
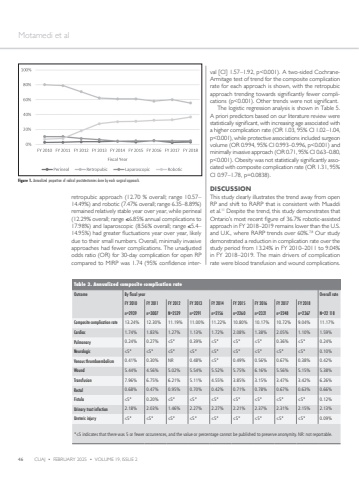
46 CUAJ %u2022 FEBRUARY 2025 %u2022 VOLUME 19, ISSUE 2 Motamedi et alretropubic approach (12.70 % overall; range 10.57%u201314.49%) and robotic (7.47% overall; range 6.35%u20138.89%) remained relatively stable year over year, while perineal (12.29% overall; range %u22646.85% annual complications to 17.98%) and laparoscopic (8.56% overall; range %u22645.4%u201314.95%) had greater fluctuations year over year, likely due to their small numbers. Overall, minimally invasive approaches had fewer complications. The unadjusted odds ratio (OR) for 30-day complication for open RP compared to MIRP was 1.74 (95% confidence interval [CI] 1.57%u20131.92, p<0.001). A two-sided CochraneArmitage test of trend for the composite complication rate for each approach is shown, with the retropubic approach trending towards significantly fewer complications (p<0.001). Other trends were not significant. The logistic regression analysis is shown in Table 5. A priori predictors based on our literature review were statistically significant, with increasing age associated with a higher complication rate (OR 1.03, 95% CI 1.02%u20131.04, p<0.001), while protective associations included surgeon volume (OR 0.994, 95% CI 0.993%u20130.996, p<0.001) and minimally invasive approach (OR 0.71, 95% CI 0.63%u20130.80, p<0.001). Obesity was not statistically significantly associated with composite complication rate (OR 1.31, 95% CI 0.97%u20131.78, p=0.0838).DISCUSSIONThis study clearly illustrates the trend away from open RP and shift to RARP that is consistent with Muaddi et al.11 Despite the trend, this study demonstrates that Ontario%u2019s most recent figure of 36.7% robotic-assisted approach in FY 2018%u20132019 remains lower than the U.S. and U.K., where RARP trends over 60%.7,8 Our study demonstrated a reduction in complication rate over the study period from 13.24% in FY 2010%u20132011 to 9.04% in FY 2018%u20132019. The main drivers of complication rate were blood transfusion and wound complications. Figure 1. Annualized proportion of radical prostatectomies done by each surgical approach.Table 3. Annualized composite complication rateOutcome By fiscal year Overall rateFY 2010 FY 2011 FY 2012 FY 2013 FY 2014 FY 2015 FY 2016 FY 2017 FY 2018n=2939 n=3007 N=2529 n=2291 n=2156 n=2260 n=2321 n=2248 n=2367 N=22 118Composite complication rate 13.24% 12.30% 11.19% 11.00% 11.22% 10.80% 10.17% 10.72% 9.04% 11.17%Cardiac 1.74% 1.83% 1.27% 1.13% 1.72% 2.08% 1.38% 2.05% 1.10% 1.59%Pulmonary 0.24% 0.27% %u22645* 0.39% %u22645* %u22645* %u22645* 0.36% %u22645* 0.24%Neurologic %u22645* %u22645* %u22645* %u22645* %u22645* %u22645* %u22645* %u22645* %u22645* 0.10%Venous thromboembolism 0.41% 0.30% NR 0.48% %u22645* 0.49% 0.56% 0.67% 0.38% 0.42%Wound 5.44% 4.56% 5.02% 5.54% 5.52% 5.75% 6.16% 5.56% 5.15% 5.38%Transfusion 7.96% 6.75% 6.21% 5.11% 4.55% 3.85% 3.15% 3.47% 3.42% 6.26%Rectal 0.68% 0.47% 0.95% 0.70% 0.42% 0.71% 0.78% 0.67% 0.63% 0.66%Fistula %u22645* 0.20% %u22645* %u22645* %u22645* %u22645* %u22645* %u22645* %u22645* 0.12%Urinary tract infection 2.18% 2.03% 1.46% 2.27% 2.27% 2.21% 2.37% 2.31% 2.15% 2.13%Ureteric injury %u22645* %u22645* %u22645* %u22645* %u22645* %u22645* %u22645* %u22645* %u22645* 0.09%*%u22645 indicates that there was 5 or fewer occurrences, and the value or percentage cannot be published to preserve anonymity. NR: not reportable.
