
Page 66 - August 2022_Fulldraftforflipbook_revised
P. 66
Wong et al
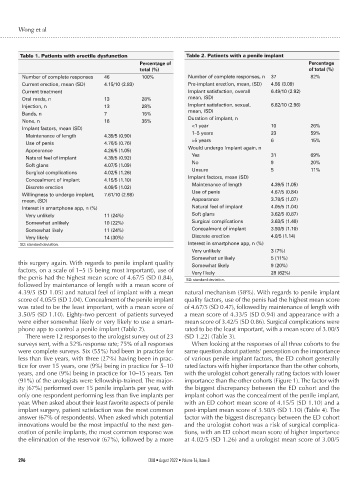
Table 1. Patients with erectile dysfunction Table 2. Patients with a penile implant
Percentage of Percentage
total (%) of total (%)
Number.of.complete.responses 46 100% Number.of.complete.responses,.n 37 82%
Current.erection,.mean.(SD) 4.15/10.(2.83) Pre-implant.erection,.mean,.(SD) 4.56.(3.09)
Current.treatment Implant.satisfaction,.overall. 6.49/10.(2.92)
Oral.meds,.n 13 28% mean,.(SD)
Injection,.n 13 28% Implant.satisfaction,.sexual,. 6.62/10.(2.96)
Bands,.n 7 15% mean,.(SD)
None,.n 16 35% Duration.of.implant,.n
Implant.factors,.mean.(SD) <1.year. 10 26%
Maintenance.of.length 4.39/5.(0.90) 1–5.years. 23 59%
Use.of.penis 4.76/5.(0.76) >5.years. 6 15%
Appearance 4.26/5.(1.05) Would.undergo.implant.again,.n
Natural.feel.of.implant 4.39/5.(0.92) Yes. 31 69%
Soft.glans 4.07/5.(1.09) No. 9 20%
Surgical.complications 4.02/5.(1.26) Unsure. 5 11%
Concealment.of.implant 4.15/5.(1.10) Implant.factors,.mean.(SD)
Discrete.erection 4.09/5.(1.02) Maintenance.of.length. 4.39/5.(1.05)
Willingness.to.undergo.implant,. 7.61/10.(2.98) Use.of.penis. 4.67/5.(0.84)
mean,.(SD) Appearance. 3.78/5.(1.07)
Interest.in.smartphone.app,.n.(%) Natural.feel.of.implant. 4.05/5.(1.04)
Very.unlikely 11.(24%) Soft.glans. 3.62/5.(0.87)
Somewhat.unlikely 10.(22%) Surgical.complications 3.63/5.(1.40)
Somewhat.likely 11.(24%) Concealment.of.implant 3.50/5.(1.10)
Very.likely 14.(30%) Discrete.erection 4.0/5.(1.14)
SD:.standard.deviation. Interest.in.smartphone.app,.n.(%)
Very.unlikely. 3.(7%)
Somewhat.unlikely. 5.(11%)
this surgery again. With regards to penile implant quality Somewhat.likely. 9.(20%)
factors, on a scale of 1–5 (5 being most important), use of Very.likely. 28.(62%)
the penis had the highest mean score of 4.67/5 (SD 0.84), SD:.standard.deviation.
followed by maintenance of length with a mean score of
4.39/5 (SD 1.05) and natural feel of implant with a mean natural mechanism (58%). With regards to penile implant
score of 4.05/5 (SD 1.04). Concealment of the penile implant quality factors, use of the penis had the highest mean score
was rated to be the least important, with a mean score of of 4.67/5 (SD 0.47), followed by maintenance of length with
3.50/5 (SD 1.10). Eighty-two percent of patients surveyed a mean score of 4.33/5 (SD 0.94) and appearance with a
were either somewhat likely or very likely to use a smart- mean score of 3.42/5 (SD 0.86). Surgical complications were
phone app to control a penile implant (Table 2). rated to be the least important, with a mean score of 3.00/5
There were 12 responses to the urologist survey out of 23 (SD 1.22) (Table 3).
surveys sent, with a 52% response rate; 75% of all responses When looking at the responses of all three cohorts to the
were complete surveys. Six (55%) had been in practice for same question about patients’ perception on the importance
less than five years, with three (27%) having been in prac- of various penile implant factors, the ED cohort generally
tice for over 15 years, one (9%) being in practice for 5–10 rated factors with higher importance than the other cohorts,
years, and one (9%) being in practice for 10–15 years. Ten with the urologist cohort generally rating factors with lower
(91%) of the urologists were fellowship-trained. The major- importance than the other cohorts (Figure 1). The factor with
ity (67%) performed over 15 penile implants per year, with the biggest discrepancy between the ED cohort and the
only one respondent performing less than five implants per implant cohort was the concealment of the penile implant,
year. When asked about their least favorite aspects of penile with an ED cohort mean score of 4.15/5 (SD 1.10) and a
implant surgery, patient satisfaction was the most common post-implant mean score of 3.50/5 (SD 1.10) (Table 4). The
answer (67% of respondents). When asked which potential factor with the biggest discrepancy between the ED cohort
innovations would be the most impactful to the next gen- and the urologist cohort was a risk of surgical complica-
eration of penile implants, the most common response was tions, with an ED cohort mean score of higher importance
the elimination of the reservoir (67%), followed by a more at 4.02/5 (SD 1.26) and a urologist mean score of 3.00/5
296 CUAJ • August 2022 • Volume 16, Issue 8