
Page 3 - CUA 2020_Onco_Prostate
P. 3
2020 CUA Abstracts
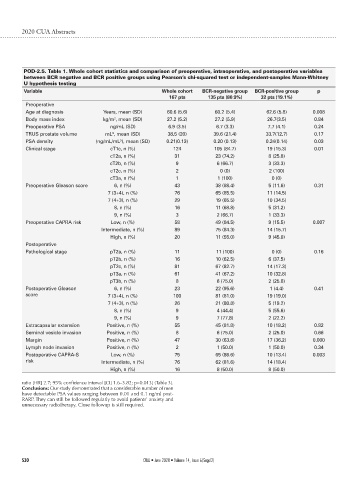
POD-2.5. Table 1. Whole cohort statistics and comparison of preoperative, intraoperative, and postoperative variables
between BCR negative and BCR positive groups using Pearson’s chi-squared test or independent-samples Mann-Whitney
U hypothesis testing
Variable Whole cohort BCR-negative group BCR-positive group p
167 pts 135 pts (80.9%) 32 pts (19.1%)
Preoperative
Age at diagnosis Years, mean (SD) 60.6 (5.6) 60.2 (5.4) 62.6 (5.8) 0.008
Body mass index kg/m , mean (SD) 27.2 (5.2) 27.2 (5.9) 26.7(3.5) 0.84
2
Preoperative PSA ng/mL (SD) 6.9 (3.5) 6.7 (3.3) 7.7 (4.1) 0.24
TRUS prostate volume mL , mean (SD) 38.5 (20) 39.6 (21.4) 33.7(12.7) 0.17
3
PSA density (ng/mL/mL ), mean (SD) 0.21(0.13) 0.20 (0.13) 0.24(0.14) 0.03
3
Clinical stage cT1c, n (%) 124 105 (84.7) 19 (15.3) 0.01
cT2a, n (%) 31 23 (74.2) 8 (25.8)
cT2b, n (%) 9 6 (66.7) 3 (33.3)
cT2c, n (%) 2 0 (0) 2 (100)
cT3a, n (%) 1 1 (100) 0 (0)
Preoperative Gleason score 6, n (%) 43 38 (88.4) 5 (11.6) 0.31
7 (3+4), n (%) 76 65 (85.5) 11 (14.5)
7 (4+3), n (%) 29 19 (65.5) 10 (34.5)
8, n (%) 16 11 (68.8) 5 (31.2)
9, n (%) 3 2 (66.7) 1 (33.3)
Preoperative CAPRA risk Low, n (%) 58 49 (84.5) 9 (15.5) 0.007
Intermediate, n (%) 89 75 (84.3) 14 (15.7)
High, n (%) 20 11 (55.0) 9 (45.0)
Postoperative
Pathological stage pT2a, n (%) 11 11 (100) 0 (0) 0.16
pT2b, n (%) 16 10 (62.5) 6 (37.5)
pT2c, n (%) 81 67 (82.7) 14 (17.3)
pT3a, n (%) 61 41 (67.2) 10 (32.8)
pT3b, n (%) 8 6 (75.0) 2 (25.0)
Postoperative Gleason 6, n (%) 23 22 (95.6) 1 (4.4) 0.41
score 7 (3+4), n (%) 100 81 (81.0) 19 (19.0)
7 (4+3), n (%) 26 21 (80.8) 5 (19.2)
8, n (%) 9 4 (44.4) 5 (55.6)
9, n (%) 9 7 (77.8) 2 (22.2)
Extracapsular extension Positive, n (%) 55 45 (81.8) 10 (18.2) 0.82
Seminal vesicle invasion Positive, n (%) 8 6 (75.0) 2 (25.0) 0.66
Margin Positive, n (%) 47 30 (63.8) 17 (36.2) 0.000
Lymph node invasion Positive, n (%) 2 1 (50.0) 1 (50.0) 0.34
Postoperative CAPRA-S Low, n (%) 75 65 (86.6) 10 (13.4) 0.003
risk Intermediate, n (%) 76 62 (81.6) 14 (18.4)
High, n (%) 16 8 (50.0) 8 (50.0)
ratio [HR] 2.7; 95% confidence interval [CI] 1.6–3.82; p=0.013] (Table 3).
Conclusions: Our study demonstrated that a considerable number of men
have detectable PSA values ranging between 0.01 and 0.1 ng/ml post-
RARP. They can still be followed regularly to avoid patients’ anxiety and
unnecessary radiotherapy. Close followup is still required.
S30 CUAJ • June 2020 • Volume 14, Issue 6(Suppl2)