
Page 4 - CUA 2020_Onco_Prostate
P. 4
Podium 2: Oncology – Prostate
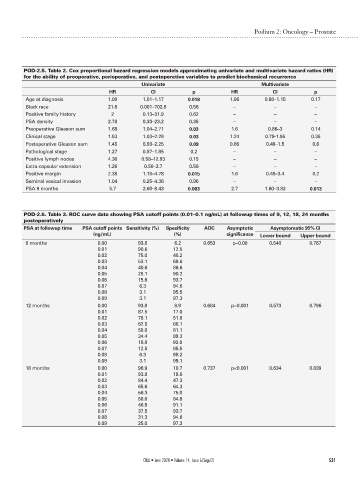
POD-2.5. Table 2. Cox proportional hazard regression models approximating univariate and multivariate hazard ratios (HR)
for the ability of preoperative, perioperative, and postoperative variables to predict biochemical recurrence
Univariate Multivariate
HR CI p HR CI p
Age at diagnosis 1.09 1.01–1.17 0.018 1.06 0.98–1.15 0.17
Black race 21.6 0.001–702.8 0.56 – – –
Positive family history 2 0.13–31.9 0.62 – – –
PSA density 2.78 0.33–23.2 0.35 – – –
Preoperative Gleason sum 1.68 1.04–2.71 0.03 1.6 0.86–3 0.14
Clinical stage 1.53 1.03–2.29 0.03 1.24 0.79-1.95 0.35
Postoperative Gleason sum 1.45 0.93–2.25 0.09 0.86 0.49–1.5 0.6
Pathological stage 1.27 0.87–1.85 0.2 – – –
Positive lymph nodes 4.36 0.58–12.93 0.15 – – –
Extra-capsular extension 1.26 0.58–2.7 0.56 – – –
Positive margin 2.38 1.18–4.78 0.015 1.6 0.48–3.4 0.2
Seminal vesical invasion 1.04 0.25–4.36 0.96 – – –
PSA 9 months 5.7 2.60–8.43 0.003 2.7 1.60–3.82 0.013
POD-2.5. Table 3. ROC curve data showing PSA cutoff points (0.01–0.1 ng/mL) at followup times of 9, 12, 18, 24 months
postoperatively
PSA at followup time PSA cutoff points Sensitivity (%) Specificity AOC Asymptotic Asymptomatic 95% CI
(ng/mL) (%) significance Lower bound Upper bound
9 months 0.00 93.8 6.2 0.653 p=0.08 0.540 0.767
0.01 90.6 12.5
0.02 75.0 48.2
0.03 53.1 69.6
0.04 40.6 86.6
0.05 28.1 90.2
0.06 15.6 93.7
0.07 6.3 94.6
0.08 3.1 95.5
0.09 3.1 97.3
12 months 0.00 93.8 8.9 0.684 p=0.001 0.573 0.796
0.01 87.5 17.0
0.02 78.1 51.8
0.03 62.5 66.1
0.04 50.0 81.1
0.05 34.4 89.3
0.06 18.8 92.0
0.07 12.5 95.5
0.08 6.3 98.2
0.09 3.1 99.1
18 months 0.00 96.9 10.7 0.737 p<0.001 0.634 0.839
0.01 93.8 19.6
0.02 84.4 47.3
0.03 65.6 64.3
0.04 56.3 75.0
0.05 50.0 84.8
0.06 46.9 91.1
0.07 37.5 93.7
0.08 31.3 94.6
0.09 25.0 97.3
CUAJ • June 2020 • Volume 14, Issue 6(Suppl2) S31