
Page 85 - Poster Sessions] CUA 2022 Annual Meeting Abstracts
P. 85
Poster 11: EDI, COVID, Patient Relations
cohort (19.5 vs. 24%). There was an increase in RC presentations (248 true in some subgroups. Therefore, it is reasonable to consider continuing
vs. 1138 visits in 2018–19), AUR presentations (373 vs. 679), and GH telehealth in this studied population post-pandemic.
presentations (370 vs. 702). In 2018–19, 7.9% of ED visits occurred within Reference
30 days of surgery, 10.1% of all patients were admitted as in-patients from 1. Morgan D, Kosteniuk J, Stewart N, et al. The Telehealth Satisfaction
the ED (6.7% for RC, 6.3% for AUR, and 19.5% for GH), and 31.8% of Scale (TeSS). Telemed J E Health 2014;20:997-1003. https://doi.
patients returned to the ED within 30 days of initial ED presentation. org/10.1089/tmj.2014.0002
Multilevel regression analyses showed that older patients (odds ratio [OR]
1.07, p=0.02), patients living in the downtown core (OR 1.34, p=0.001), MP-11.9
and 2018–19 ED patients (OR 1.23, p=0.039) were more likely to return
to the ED within 30 days. Time to be seen in urology clinic post-ED visit Septic and febrile kidney stone presentation during the COVID-
increased significantly over time for the entire cohort (mean 21.1 vs. 29.8 19 pandemic at Nova Scotia Health Central Zone hospitals:
days, p<0.001) and 14.4% of all patients had multiple ED visits prior to What is the effect of lack of access to care during pandemic
being seen in urology clinic (9% vs. 17% in 2018–9, p<0.001). restrictions? 1 1 1,2,3,4
Conclusions: The incidence of acute urological presentations increased Jesse Spooner , Kaveh Masoumi-Ravandi , Gabriela Ilie , Thomas
1
1
significantly over a 10-year period at a tertiary care hospital. These find- 1 Skinner , Andrea G. Lantz Powers
ings demonstrate an increasing burden of acute urological disease that is 2 Department of Urology, Dalhousie University, Halifax, NS, Canada;
outpacing population growth and currently available healthcare resources. Department of Community and Health Epidemiology, Dalhousie
University, Halifax, NS, Canada; Department of Psychology and
3
Neuroscience, Dalhousie University, Halifax, NS, Canada; Department
4
MP-11.8 of Radiation Oncology, Dalhousie University, Halifax, NS, Canada
Patient satisfaction with telehealth during the COVID-19 Introduction: At the Nova Scotia Health hospitals in Halifax, a subjective
pandemic in a Canadian community urologic practice increase in the number of septic/febrile patients requiring emergent stone
Ora Meade , Riley B. Meade , William Meade 1 therapy has been observed. This may be due to reductions in elective
1
1
1 Department of Urology, Kawartha Urology, Peterborough, ON, Canada surgeries and limited access to laboratory tests, such as urinalysis and
Introduction: Measuring patient satisfaction is important and useful for culture. This study examines the volume and severity of septic stone
continual quality improvement. During the COVID-19 pandemic, tele- patients requiring emergent intervention amidst the COVID-19 pandemic
health has become increasingly useful for patient-physician interactions. healthcare restrictions.
The aim of this study is to evaluate patient satisfaction with telephone Methods: In this retrospective, single-center, observational study, we
appointments replacing the standard in-person appointments in a regional reviewed the charts of all urgent or emergent septic stone patients
urological practice. requiring ureteral stent insertion from August 2019 to January 2020 (pre-
Methods: Using the validated telehealth satisfaction scale (TeSS), min- COVID cohort) and August 2020 to January 2021 (intra-COVID cohort).
imally modified for use with urological patients, this study was completed The primary outcome was the number of patients requiring stenting.
1
in Peterborough, Ontario, which serves a population of approximately The secondary outcome included the number of patients classified as
300 000 people. A total of 761 patients were called, with 400 surveys emergency status as per the American Society of Anesthesiologists (ASA)
completed (361 patients didn’t answer or declined). One patient from classification.
the 400 was later excluded from analysis due to missing data. Questions Results: The number of septic stone presentations increased by approxi-
1–7 addressed the quality and general satisfaction of the telehealth phone mately 17% during the COVID pandemic (24 patients pre-COVID vs.
calls, questions 8 and 9 are characteristics hypothesized as possibly affect- 28 patients intra-COVID). There was an increase in patients classified as
ing patient preference, and question 10 is a global rating of preference. emergency (ASA) of approximately 62% (13 patients pre-COVID vs. 21
Results: Refer to Tables 1–5 for survey analysis and Tables 6–8 for statis- patients intra-COVID). The pre-COVID timeframe showed a predomin-
tical significance testing amongst subgroups. Of the 399 patients, 248 ance of women (n=18) compared to men (n=6), similar to the intra-COVID
(62.2%) would prefer in-person appointments. In patients less than 60 cohort, demonstrating 21 females and seven men. The mean age for the
years old, 14.7% would prefer in-person appointments, while 73.1% pre- and intra-COVID cohorts were 60.1 and 59.9 years, respectively.
of those over age 60 would prefer in-person appointments (statistically Conclusions: An increased number of patients required ureteral stent
significant). Given the large geographical area served, the impact on insertion for septic kidney stones during COVID-related reductions in
commute was examined and was found to not be statistically significant. healthcare. The number of patients classified as an emergency procedure
Consultation vs. followup was examined; 83.8% of the consult patients (ASA classifciation) increased. The exact cause is unknown but during
vs. only 46.6% of the followup patients would prefer in-person appoint- this timeframe, there was delayed urological followup, lack of access to
ments (statistically significant). primary care, deferred elective treatment, limited access to lab esting,
Conclusions: Most of the people surveyed found telehealth to be respect- and a reluctance by patients to seek medical care due to fear of exposure
ful and thorough. Despite the majority preferring an in-person visit, there to COVID-19.
is a non-trivial minority that would prefer telehealth; this is particularly
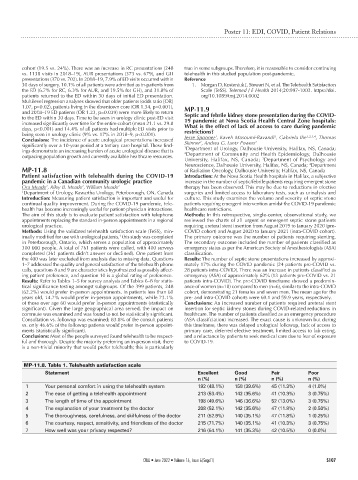
MP-11.8. Table 1. Telehealth satisfaction scale
Statement Excellent Good Fair Poor
n (%) n (%) n (%) n (%)
1 Your personal comfort in using the telehealth system 192 (48.1%) 158 (39.6%) 45 (11.3%) 4 (1.0%)
2 The ease of getting a telehealth appointment 213 (53.4%) 142 (35.6%) 41 (10.3%) 3 (0.75%)
3 The length of time of the appointment 198 (49.6%) 146 (36.6%) 52 (13.0%) 3 (0.75%)
4 The explanation of your treatment by the doctor 208 (52.1%) 142 (35.6%) 47 (11.8%) 2 (0.50%)
5 The thoroughness, carefulness, and skilfulness of the doctor 211 (52.9%) 140 (35.1%) 47 (11.8%) 1 (0.25%)
6 The courtesy, respect, sensitivity, and friendless of the doctor 215 (71.7%) 140 (35.1%) 41 (10.3%) 3 (0.75%)
7 How well was your privacy respected? 216 (54.1%) 141 (35.3%) 42 (10.5%) 0 (0.0%)
CUAJ • June 2022 • Volume 16, Issue 6(Suppl1) S107