Page 14 - CUA 2020_Endourology
P. 14

2020 CUA Abstracts


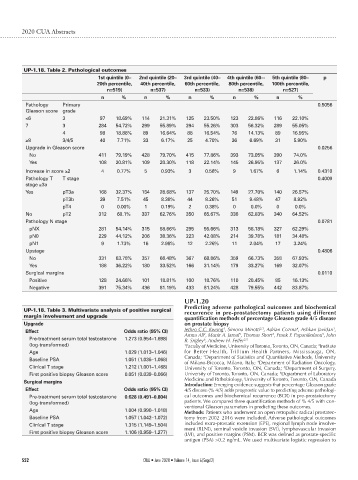
         UP-1.18. Table 2. Pathological outcomes
                                 1st quintile (0–  2nd quintile (20–  3rd quintile (40–  4th quintile (60–-  5th quintile (80–  p
                                 20th percentile,   40th percentile,   60th percentile,   80th percentile,   100th percentile,
                                    n=519)        n=537)         n=533)        n=538)        n=527)
                                  n      %      n      %       n      %      n      %      n      %
         Pathology   Primary                                                                             0.5056
         Gleason score grade
         ≤6          3            97   18.69%  114   21.31%   125   23.50%  123   22.86%   116   22.10%
         7           3           284   54.72%  299   55.89%   294   55.26%  303   56.32%   289   55.05%
                     4            98   18.88%   89   16.64%   88    16.54%   76   14.13%   89    16.95%
         ≥8          3/4/5        40   7.71%    33    6.17%   25    4.70%    36    6.69%   31    5.90%
         Upgrade in Gleason score                                                                        0.0256
           No                    411   79.19%  428   79.70%   415   77.86%  393   73.05%   390   74.0%
           Yes                   108   20.81%  109   20.30%   118   22.14%  145   26.95%   137   26.0%
         Increase in score ≥2     4    0.77%    5     0.93%    3    0.56%    9     1.67%   6     1.14%   0.4310
         Pathology T   T stage                                                                           0.4009
         stage ≥3a
         Yes         pT3a        168   32.37%  154   28.68%   137   25.70%  149   27.70%   140   26.57%
                     pT3b         39   7.51%    45    8.38%   44    8.26%    51    9.48%   47    8.92%
                     pT4          0    0.00%    1     0.19%    2    0.38%    0     0.0%    0     0.0%
         No          pT2         312   60.1%   337   62.76%   350   65.67%  338   62.83%   340   64.52%
         Pathology N stage                                                                               0.0781
           pNX                   281   54.14%  315   58.66%   295   55.66%  313   58.18%   327   62.29%
           pN0                   229   44.12%  206   38.36%   223   42.08%  214   39.78%   181   34.48%
           pN1                    9    1.73%    16    2.98%   12    2.26%    11    2.04%   17    3.24%
         Upstage                                                                                         0.4806
           No                    331   63.78%  357   66.48%   367   68.86%  359   66.73%   358   67.93%
           Yes                   188   36.22%  180   33.52%   166   31.14%  179   33.27%   169   32.07%
         Surgical margins                                                                                0.0110
           Positive              128   24.66%  101   18.81%   100   18.76%  110   20.45%   85    16.13%
           Negative              391   75.34%  436   81.19%   433   81.24%  428   79.55%   442   83.87%

                                                             UP-1.20
                                                             Predicting adverse pathological outcomes and biochemical
         UP-1.18. Table 3. Multivariate analysis of positive surgical   recurrence in pre-prostatectomy patients using different
         margin involvement and upgrade                      quantification methods of percentage Gleason grade 4/5 disease
         Upgrade                                             on prostate biopsy
                                                                          1
                                                                                      2,3
                                                                                                  4
                                                                                                              1
         Effect                           Odds ratio (95% CI)  Jethro C.C. Kwong , Simona Minotti , Adrian Cozma , Ashkan Javidan ,
                                                                                                          5
                                                             Amna Ali , Munir A. Jamal , Thomas Short , Frank F. Papanikolaou , John
                                                                                          5
                                                                    2
                                                                               5
           Pre-treatment serum total testosterone   1.273 (0.954–1.698)  R. Srigley , Andrew H. Feifer 2,5
                                                                    6
           (log-transformed)                                 1 Faculty of Medicine, University of Toronto, Toronto, ON, Canada;  Institute
                                                                                                         2
           Age                            1.029 (1.013–1.046)  for  Better  Health, Trillium  Health  Partners,  Mississauga,  ON,
                                                             Canada;  Department of Statistics and Quantitative Methods, University
                                                                   3
           Baseline PSA                   1.051 (1.035–1.068)
                                                                                     4
                                                             of Milano-Bicocca, Milano, Italy;  Department of Radiation Oncology,
           Clinical T stage               1.212 (1.001–1.468)  University of Toronto, Toronto, ON, Canada;  Department of Surgery,
                                                                                              5
                                                                                            6
           First positive biopsy Gleason score  0.051 (0.039–0.066)  University of Toronto, Toronto, ON, Canada;  Department of Laboratory
                                                             Medicine and Pathobiology, University of Toronto, Toronto, ON, Canada
         Surgical margins
                                                             Introduction: Emerging evidence suggests that percentage Gleason grade
         Effect                           Odds ratio (95% CI)  4/5 disease (% 4/5) adds prognostic value to predicting adverse pathologi-
           Pre-treatment serum total testosterone   0.628 (0.491–0.804)  cal outcomes and biochemical recurrence (BCR) in pre-prostatectomy
           (log-transformed)                                 patients. We compared three quantification methods of % 4/5 with con-
           Age                            1.004 (0.990–1.018)  ventional Gleason parameters in predicting these outcomes.
                                                             Methods: Patients who underwent an open retropubic radical prostatec-
           Baseline PSA                   1.057 (1.042–1.072)  tomy from 2002–2016 were included. Adverse pathological outcomes
           Clinical T stage               1.315 (1.149–1.504)  included extra-prostatic extension (EPE), regional lymph node involve-
           First positive biopsy Gleason score  1.106 (0.959–1.277)  ment (RLNI), seminal vesicle invasion (SVI), lymphovascular invasion
                                                             (LVI), and positive margins (PSM). BCR was defined as prostate-specific
                                                             antigen (PSA) >0.2 ng/mL. We used multivariate logistic regression to
        S52                                     CUAJ • June 2020 • Volume 14, Issue 6(Suppl2)
   9   10   11   12   13   14   15   16   17   18   19