
Page 11 - CUA 2020_Functional Urology
P. 11
2020 CUA Abstracts
supine and prone positions, in an attempt to identify the optimal method
for the prediction of pyeloplasty.
Methods: Patients with initial high-grade hydronephrosis (Society of Fetal
Urology [SFU] grade 3 and 4) from 2008–2014 were retrospectively
reviewed. All ultrasounds were reviewed by one blinded investigator. In
the mid-renal transverse plane, the APD was measured at the innermost,
renal contour and maximum extrarenal regions of the renal pelvis both
supine and prone. The six APD measurements were compared based on
the outcome (pyeloplasty vs. conservative management). A ROC curve
evaluated the ability of the various APD measurements to predict surgery,
the cutoff value being the lowest diameter with 100% specificity.
Results: We included 124 patients (150 units) (Table 1): 50 units (47
patients) with pyeloplasty and 100 renal units (77 patients) managed
conservatively. The comparison based on management choice showed
a significant difference in every APD measurement (p<0.001 for all).
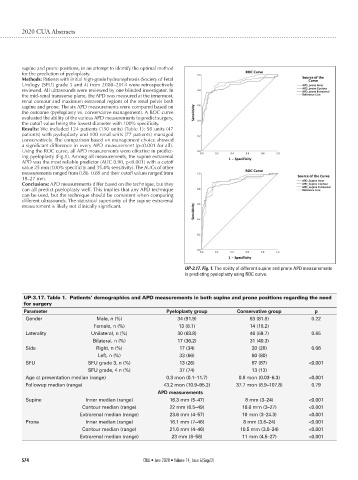
Using the ROC curve, all APD measurements were effective in predict-
ing pyeloplasty (Fig.1). Among all measurements, the supine extrarenal
APD was the most reliable predictor (AUC 0.90, p<0.001) with a cutoff
value 25 mm (100% specificity and 35.4% sensitivity). The AUCs of other
measurements ranged from 0.86–0.89 and their cutoff values ranged from
18–27 mm.
Conclusions: APD measurements differ based on the technique, but they
can all predict pyeloplasty well. This implies that any APD technique
can be used, but the technique should be consistent when comparing
different ultrasounds. The statistical superiority of the supine extrarenal
measurement is likely not clinically significant.
UP-3.17. Fig. 1. The ability of different supine and prone APD measurements
in predicting pyeloplasty using ROC curve.
UP-3.17. Table 1. Patients’ demographics and APD measurements in both supine and prone positions regarding the need
for surgery
Parameter Pyeloplasty group Conservative group p
Gender Male, n (%) 34 (91.9) 63 (81.8) 0.22
Female, n (%) 13 (8.1) 14 (18.2)
Laterality Unilateral, n (%) 30 (63.8) 46 (59.7) 0.65
Bilateral, n (%) 17 (36.2) 31 (40.3)
Side Right, n (%) 17 (34) 20 (20) 0.06
Left, n (%) 33 (66) 80 (80)
SFU SFU grade 3, n (%) 13 (26) 87 (87) <0.001
SFU grade, 4 n (%) 37 (74) 13 (13)
Age at presentation median (range) 0.3 mon (0.1–11.7) 0.8 mon (0.03–6.3) <0.001
Followup median (range) 43.2 mon (10.9–95.2) 37.7 mon (8.9–107.8) 0.79
APD measurements
Supine Inner median (range) 16.3 mm (5–47) 8 mm (3–24) <0.001
Contour median (range) 22 mm (6.5–49) 10.6 mm (3–27) <0.001
Extrarenal median (range) 23.6 mm (4–57) 10 mm (3–24.3) <0.001
Prone Inner median (range) 16.1 mm (7–46) 8 mm (3.8–24) <0.001
Contour median (range) 21.6 mm (4–46) 10.5 mm (3.8–24) <0.001
Extrarenal median (range) 23 mm (8–58) 11 mm (4.5–27) <0.001
S74 CUAJ • June 2020 • Volume 14, Issue 6(Suppl2)