
Page 23 - Flipbook
P. 23
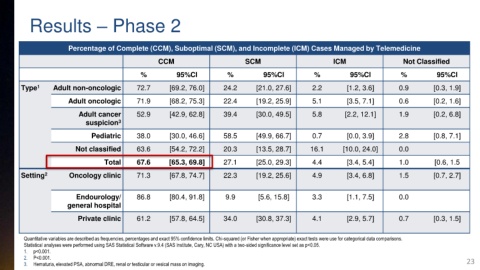
Results – Phase 2


                     Percentage of Complete (CCM), Suboptimal (SCM), and Incomplete (ICM) Cases Managed by Telemedicine

                                                CCM                        SCM                       ICM                  Not Classified
                                           %          95%CI          %          95%CI          %          95%CI          %          95%CI

       Type 1    Adult non-oncologic      72.7      [69.2, 76.0]    24.2      [21.0, 27.6]     2.2       [1.2, 3.6]      0.9       [0.3, 1.9]
                     Adult oncologic      71.9      [68.2, 75.3]    22.4      [19.2, 25.9]     5.1       [3.5, 7.1]      0.6       [0.2, 1.6]

                         Adult cancer     52.9      [42.9, 62.8]    39.4      [30.0, 49.5]     5.8       [2.2, 12.1]     1.9       [0.2, 6.8]
                           suspicion 3

                            Pediatric     38.0      [30.0, 46.6]    58.5      [49.9, 66.7]     0.7       [0.0, 3.9]      2.8       [0.8, 7.1]
                        Not classified    63.6      [54.2, 72.2]    20.3      [13.5, 28.7]    16.1      [10.0, 24.0]     0.0

                                Total     67.6      [65.3, 69.8]    27.1      [25.0, 29.3]     4.4       [3.4, 5.4]      1.0       [0.6, 1.5
       Setting 2      Oncology clinic     71.3      [67.8, 74.7]    22.3      [19.2, 25.6]     4.9       [3.4, 6.8]      1.5       [0.7, 2.7]


                        Endourology/      86.8      [80.4, 91.8]     9.9      [5.6, 15.8]      3.3       [1.1, 7.5]      0.0
                     general hospital
                        Private clinic    61.2      [57.8, 64.5]    34.0      [30.8, 37.3]     4.1       [2.9, 5.7]      0.7       [0.3, 1.5]


        Quantitative variables are described as frequencies, percentages and exact 95% confidence limits. Chi-squared (or Fisher when appropriate) exact tests were use for categorical data comparisons.
        Statistical analyses were performed using SAS Statistical Software v.9.4 (SAS Institute, Cary, NC USA) with a two-sided significance level set as p<0.05.
        1.  p<0.001.
        2.  P<0.001.                                                                                                                         23
        3.  Hematuria, elevated PSA, abnormal DRE, renal or testicular or vesical mass on imaging.