
Page 25 - Flipbook
P. 25
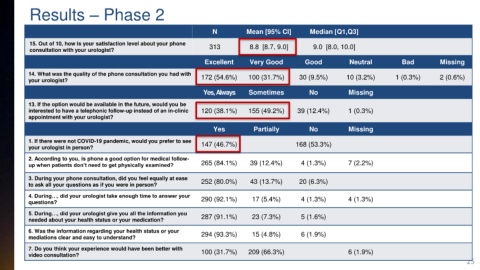
Results – Phase 2


                                                                 N         Mean [95% CI]      Median [Q1,Q3]

          15. Out of 10, how is your satisfaction level about your phone   313  8.8  [8.7, 9.0]  9.0  [8.0, 10.0]
          consultation with your urologist?
                                                              Excellent     Very Good        Good         Neutral         Bad        Missing
          14. What was the quality of the phone consultation you had with   172 (54.6%)  100 (31.7%)  30 (9.5%)  10 (3.2%)  1 (0.3%)  2 (0.6%)
          your urologist?

                                                              Yes, Always   Sometimes         No          Missing
          13. If the option would be available in the future, would you be
          interested to have a telephonic follow-up instead of an in-clinic   120 (38.1%)  155 (49.2%)  39 (12.4%)  1 (0.3%)
          appointment with your urologist?

                                                                 Yes         Partially        No          Missing
          1. If there were not COVID-19 pandemic, would you prefer to see   147 (46.7%)   168 (53.3%)
          your urologist in person?
          2. According to you, is phone a good option for medical follow-
          up when patients don’t need to get physically examined?  265 (84.1%)  39 (12.4%)  4 (1.3%)      7 (2.2%)

          3. During your phone consultation, did you feel equally at ease   252 (80.0%)  43 (13.7%)  20 (6.3%)
          to ask all your questions as if you were in person?
          4. During…, did your urologist take enough time to answer your   290 (92.1%)  17 (5.4%)  4 (1.3%)  4 (1.3%)
          questions?

          5. During…, did your urologist give you all the information you   287 (91.1%)  23 (7.3%)  5 (1.6%)
          needed about your health status or your medication?
          6. Was the information regarding your health status or your   294 (93.3%)  15 (4.8%)  6 (1.9%)
          mediations clear and easy to understand?
          7. Do you think your experience would have been better with   100 (31.7%)  209 (66.3%)          6 (1.9%)
          video consultation?
                                                                                                                                             25